

In a recent comprehensive data report, now available at Field Service News, Aquant analyzed how medical device service organizations and their workforce measured up against industry benchmarks and explored service performance from a customer perspective.
Aquant analyzed nearly 1.6 million service tickets to reveal:
- A snapshot of the overall industry and how companies measure up against each other
- The reason why hitting your KPIs rarely equates to outstanding customer experiences
- The spiraling impact of a missed First Time Fix (FTF) event
- An increase in the workforce skills gap
- COVID-19’s impact on service
We provide recommendations to:
- Make immediate business improvements by looking at service performance in a comprehensive way
- Boost the customer experience in the short-term and long-term
- Upskill a team in the face of a talent shortage
- Succeed amid post-Covid service disruptions
KPIs are Only as Meaningful as the Way They’re Measured
FIRST TIME FIX IS A DISTORTED BAROMETER OF SERVICE QUALITY
Service organizations that monitor KPIs in isolation may think they are hitting their numbers and providing great service. However, there’s a good chance that they are providing sub-par customer experiences.
Med device service organizations that measure FTF rates at seven days or 14 days have much lower long-term success rates than their dashboards reveal. This is because fixes marked as complete on day one often require additional visits on day two through day 21 to fix a persistent problem that may have been incorrectly or inadequately addressed on the first visit.
For example, if you wrap a leaking hose with duct tape to stop a leak, you’ve put a bandaid on a problem without fixing the root issue. But when the leak reappears in two weeks, a new service ticket will be open. In reality, that second call is a repeat visit.
- 87% is the FTF rates when measured in 7-day windows
- 81% is the FTF rates when measured in 14-day windows
- 73% is the FTF rates when measured in 30-day windows
The other argument against relying too heavily on FTF rates is that high values often mask other issues, such as:
• Employees who shotgun parts to hit KPIs
• High labor costs due to over-reliance on industry veterans
SERVICE ORGANIZATIONS SUFFER A WIDE CUSTOMER EXPERIENCE GAP
The way organizations provide service today is not in tune with customer expectations. Even with an average FTF rate, one in every four jobs requires at least one repeat visit.
Variations on FTF measurements are one reason for the disconnect. Other contributing factors include:
• Lack of insights into an organization’s core health
• A workforce labor shortage
• Inability to connect the dots between service performance and customer experience
• Reactive vs. proactive service
THE KNOWLEDGE GAP IS GETTING MORE EXPENSIVE
In 2022, medical device service organizations face even larger hiring challenges than in the past. This has left the industry with tens of thousands of unfilled jobs, and some reports estimate there will be an industry-wide shortage of three million skilled trade workers in the next five years. Among medical device service teams:
• The 80th percentile has a 86% FTF rate.
• Those in the 20th percentile have a 57% FTF rate.
• Service challengers cost organizations 26% more than service heroes.
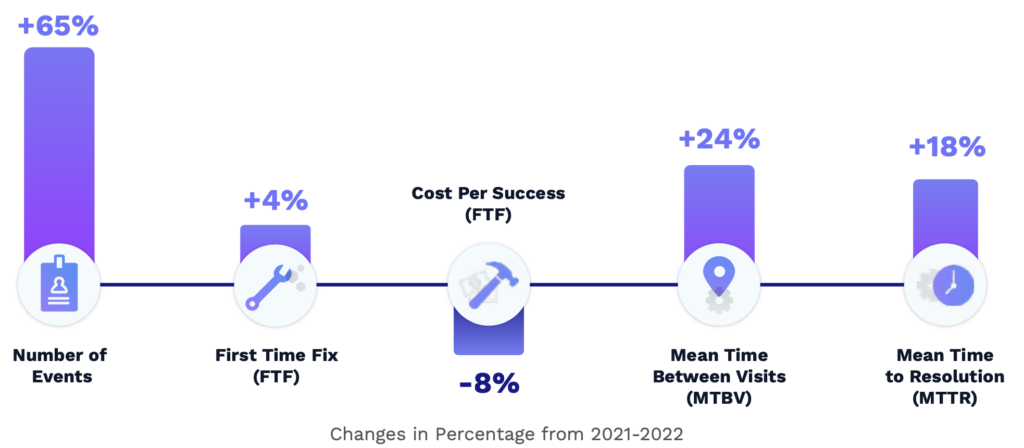
COVID’s Impact on Service
Mean Time to Resolution (MTTR) increased 24% during COVID for med device service organizations. That’s a big contrast to a 4% decline in MTTR for organizations across all industries.
However, med device service organizations saw a large jump in the number of jobs vs all other industries. The number of service events for med device service teams increased 65%. That’s in sharp contrast to a 13% decline in service calls for the industry overall.
This jump in critical demand, coupled with a labor shortage and a skills gap, has led service leaders in the med device space to look for technology solutions that will bridge the gap.
The Opportunity
The insights in this report, gleaned from actual service data, provides a path to service improvements through a multi-step process:
• LEARN how to accurately identify your organization’s core service problems by better understanding the patterns in your service data.
• USE those data patterns to drive actionable service recommendations—for management-level decisions and in-the-field fixes.
• PLAN proactive customer experience enhancements.
• MAKE more informed workforce training and hiring decisions to shrink the skills gap.
How We Compiled the Data
Aquant gathered and analyzed actual anonymized service data from leading med device service organizations. The data in this report was measured before an organization deployed Aquant’s AI solution.
THE REPORT MEASURES:
- 26 organizations, including service divisions within OEMs and third- party service organizations
- More than 1.6 million work orders
- More than 8,000 technicians
- More than $2.6 billion total in service costs
- An average of 3 years of service data per company
How is This Report Different From Standard Service Benchmarks?
• We analyzed real service data to understand the health and outlook of organizations instead of relying on service executives to self-report KPIs. Data sources included service tickets, CRM data, parts information, and more.
• We charted the skills gap. This makes it easy to extrapolate how much an organization can gain in efficiency and cost savings if the entire workforce was able to perform more like your experts.
• We analyzed the data using the Aquant Service Intelligence Platform, which includes a Natural Language Processing (NLP) engine built for the service industry. This lets us dig deep into data ranging from CRM and parts inventory to service tickets, handwritten records, and other information that never makes it into any databases. We are able to draw out patterns and recommendations based on raw data.
Watch out for the next feature from this report next week in which we analyze service benchmarks across 5 key KPIs.
FSN subscribers can read the full report right now. Please note this paper will only be available for a limited period for FSN FREE subscribers.
![]() Data usage note: By accessing this content you consent to the contact details submitted when you registered as a subscriber to fieldservicenews.com to be shared with the listed sponsor of this premium content Aquant who may contact you for legitimate business reasons to discuss the content of this white paper.
Data usage note: By accessing this content you consent to the contact details submitted when you registered as a subscriber to fieldservicenews.com to be shared with the listed sponsor of this premium content Aquant who may contact you for legitimate business reasons to discuss the content of this white paper.
